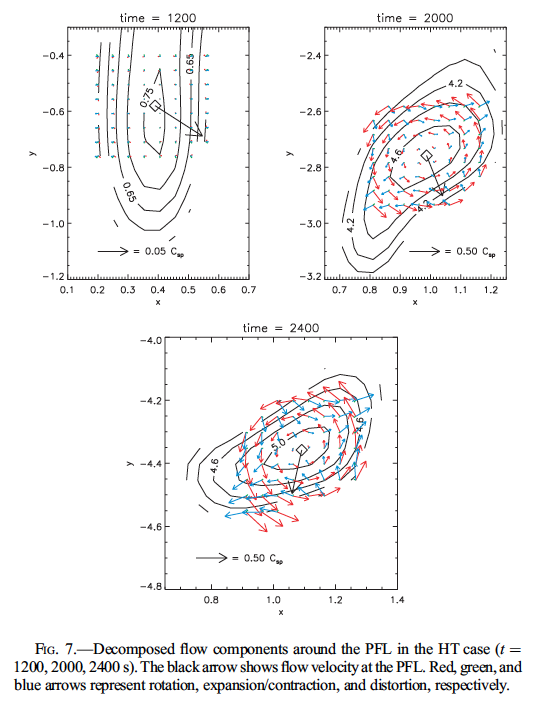
Counterclockwise rotating flow arises in the main polarity region which apparently rotates clockwise. PFL represents "peak flux location" (not principal field line).
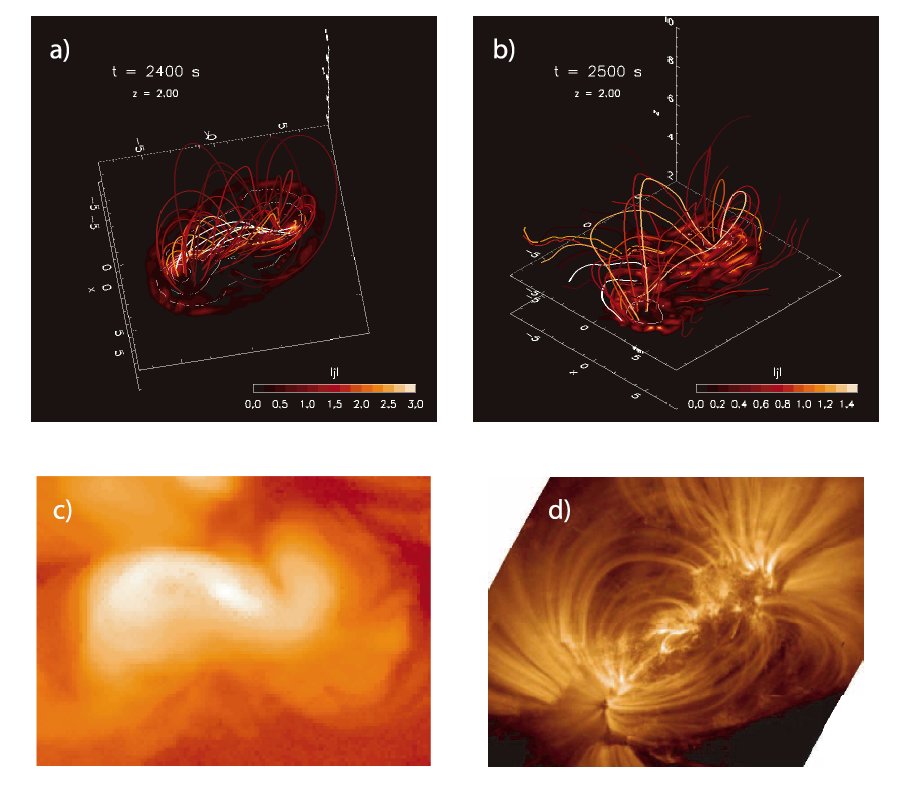
Figure 11: (a) Sigmoidal structure formed in ST case, which is composed of those field lines with high current density at their chromospheric footpoints. The color map shows the distribution of current density strength in a chromospheric layer, while contours on this map represent vertical magnetic flux density. Colors of each field line represents current density strength at the footpoint in this layer (bright
color indicates high current density). (b) Same as (a), but for potential field-like arcade formed in WT case. (c) Soft X-ray image of a sigmoid observed by
Yohkoh. (d) EUV image of a potential field-like arcade observed by TRACE.
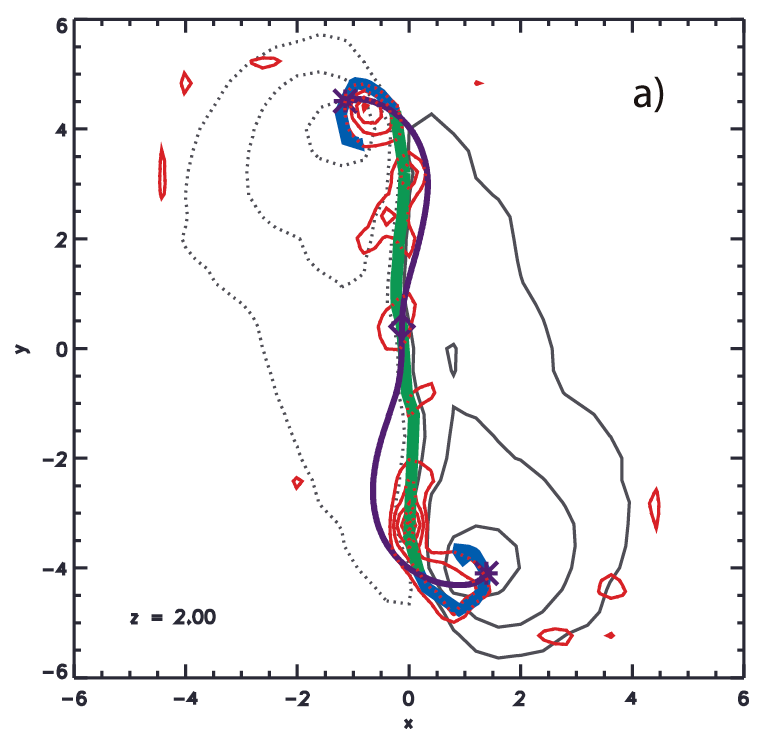
Figure 12a: Distributions of current density strength (red contours) and vertical magnetic flux density (gray contours; solid lines for positive flux and dotted
lines for negative flux) are presented for ST case. These contours are plotted in the same chromospheric layer as that presented in Figures 11a and 11b. The thick green curve was obtained by connecting
bald patches (BPs) (BP curve), while the thin violet line is a single field line passing through one of the BPs (BP field line). The diamond and asterisks indicate locations of the BP
and footpoints of the BP field line, respectively. The thick blue curves were obtained by connecting footpoints of multiple BP field lines (BP footpoint curves). High current density tends to be distributed along the BP curve and BP footpoint curves.