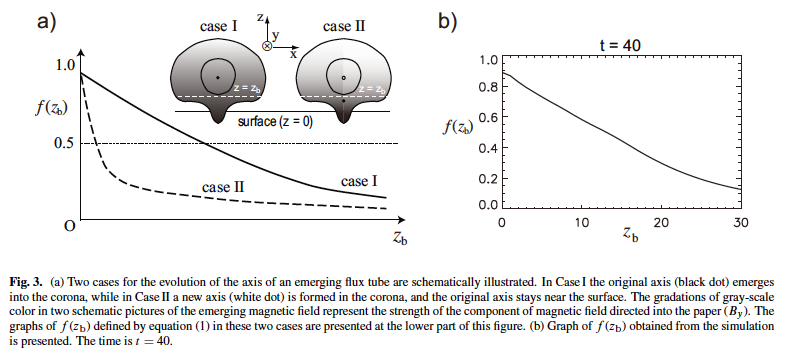
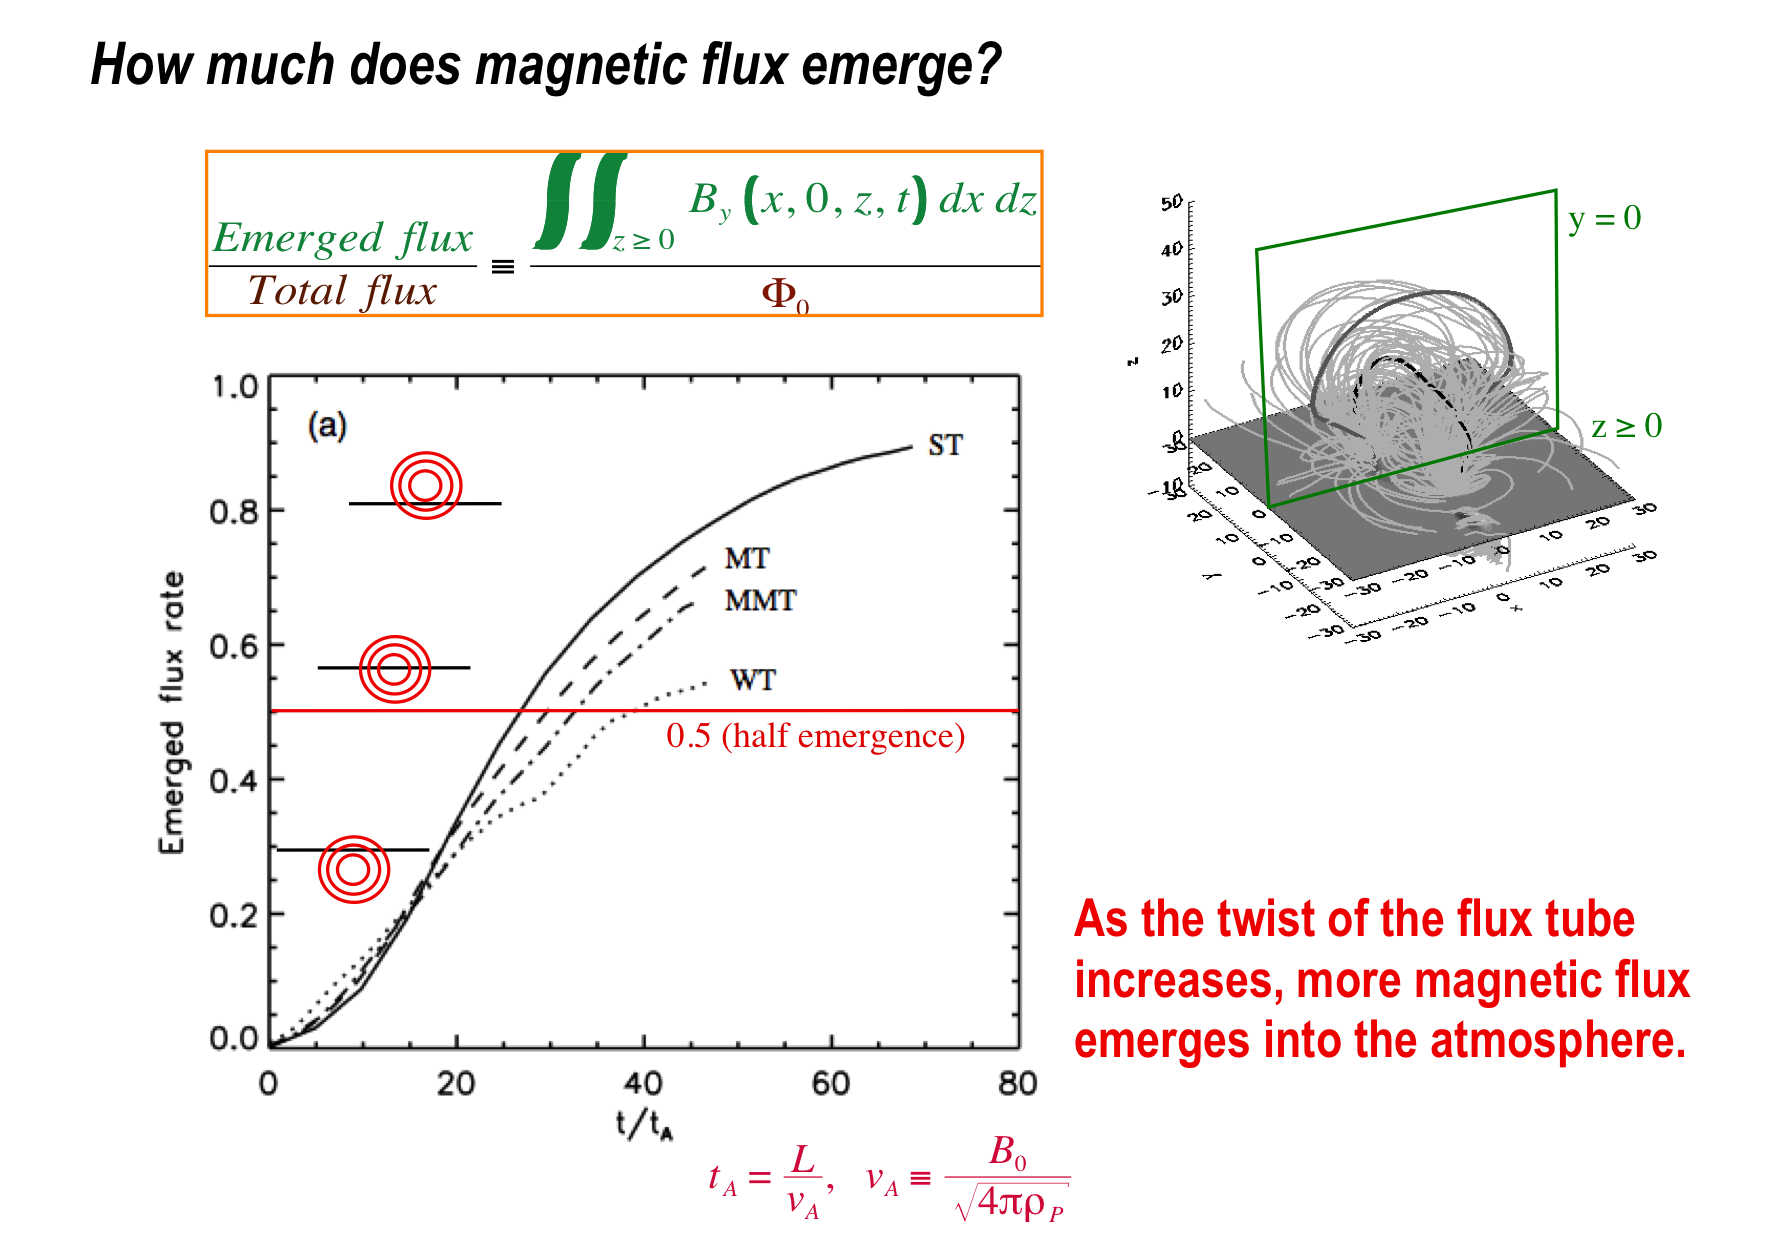
There are two cases concerning evolution of the axis of an emerging flux tube, as schematically explained in Figure 3a. In Case I the original axis (black dot) has emerged into a corona, while in Case II a new axis (white dot) has appeared in the corona and the original axis (black dot) stays near to a surface. These two cases may be distinguished by measuring the emerged rate of magnetic flux (ratio of net emerged flux to the total flux contained by the flux tube) at each atmospheric level (z = zb), given by
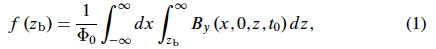
where Φ0 is the total flux
and t0 is a selected time. In Case II f(zb) has a sharply decreasing profile because almost half of the total flux remains near and below the surface. In a flux-emergence simulation reported in Magara (2013), we found that the value of zb giving f(zb) = 0.5 is between 10 and 20 (normalized by 540 km; Figure 3b) at t0 = 40 (a late phase of emergence in the simulation),
and about 90% of the total flux emerged above the surface at
that time, which seems to support Case I.
Reference
Magara, T. 2013 PASJ, 65, L5
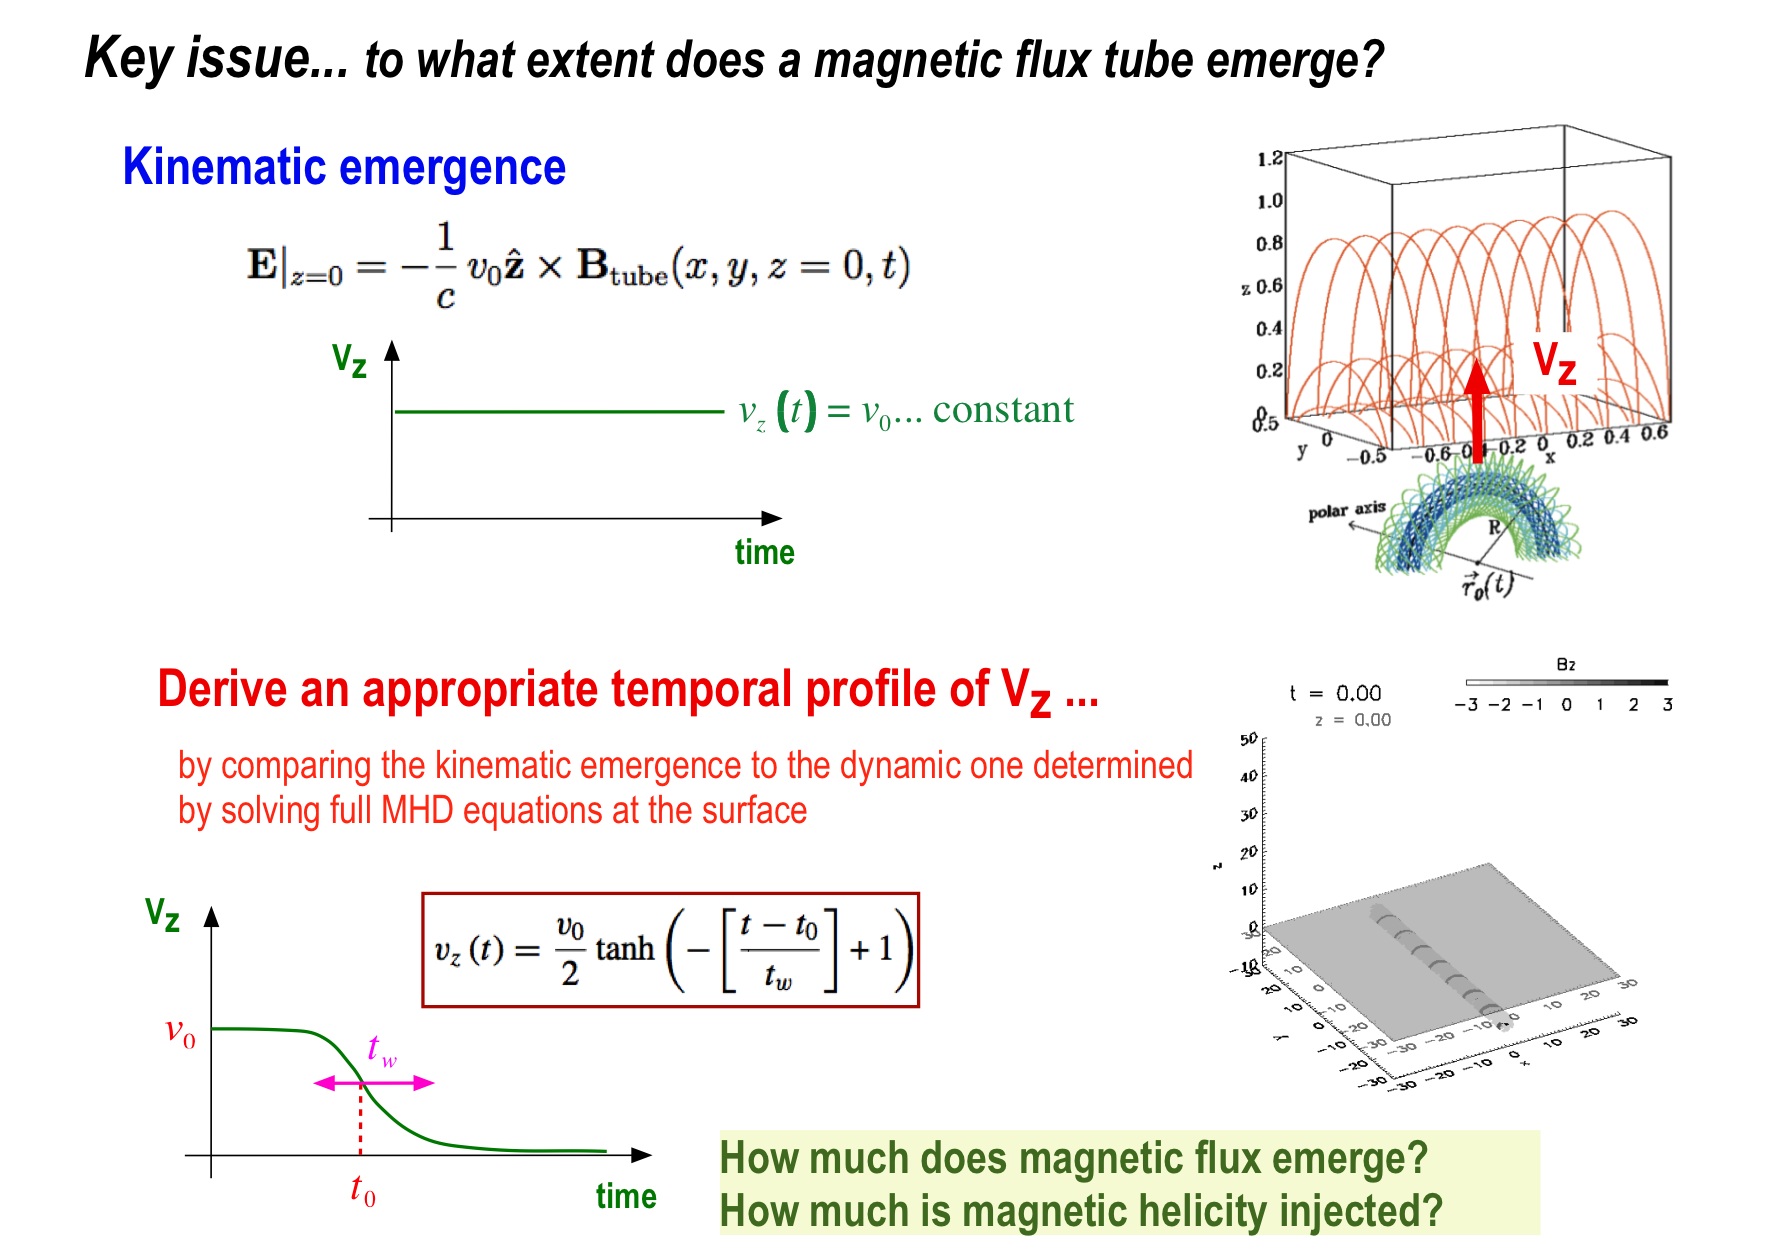
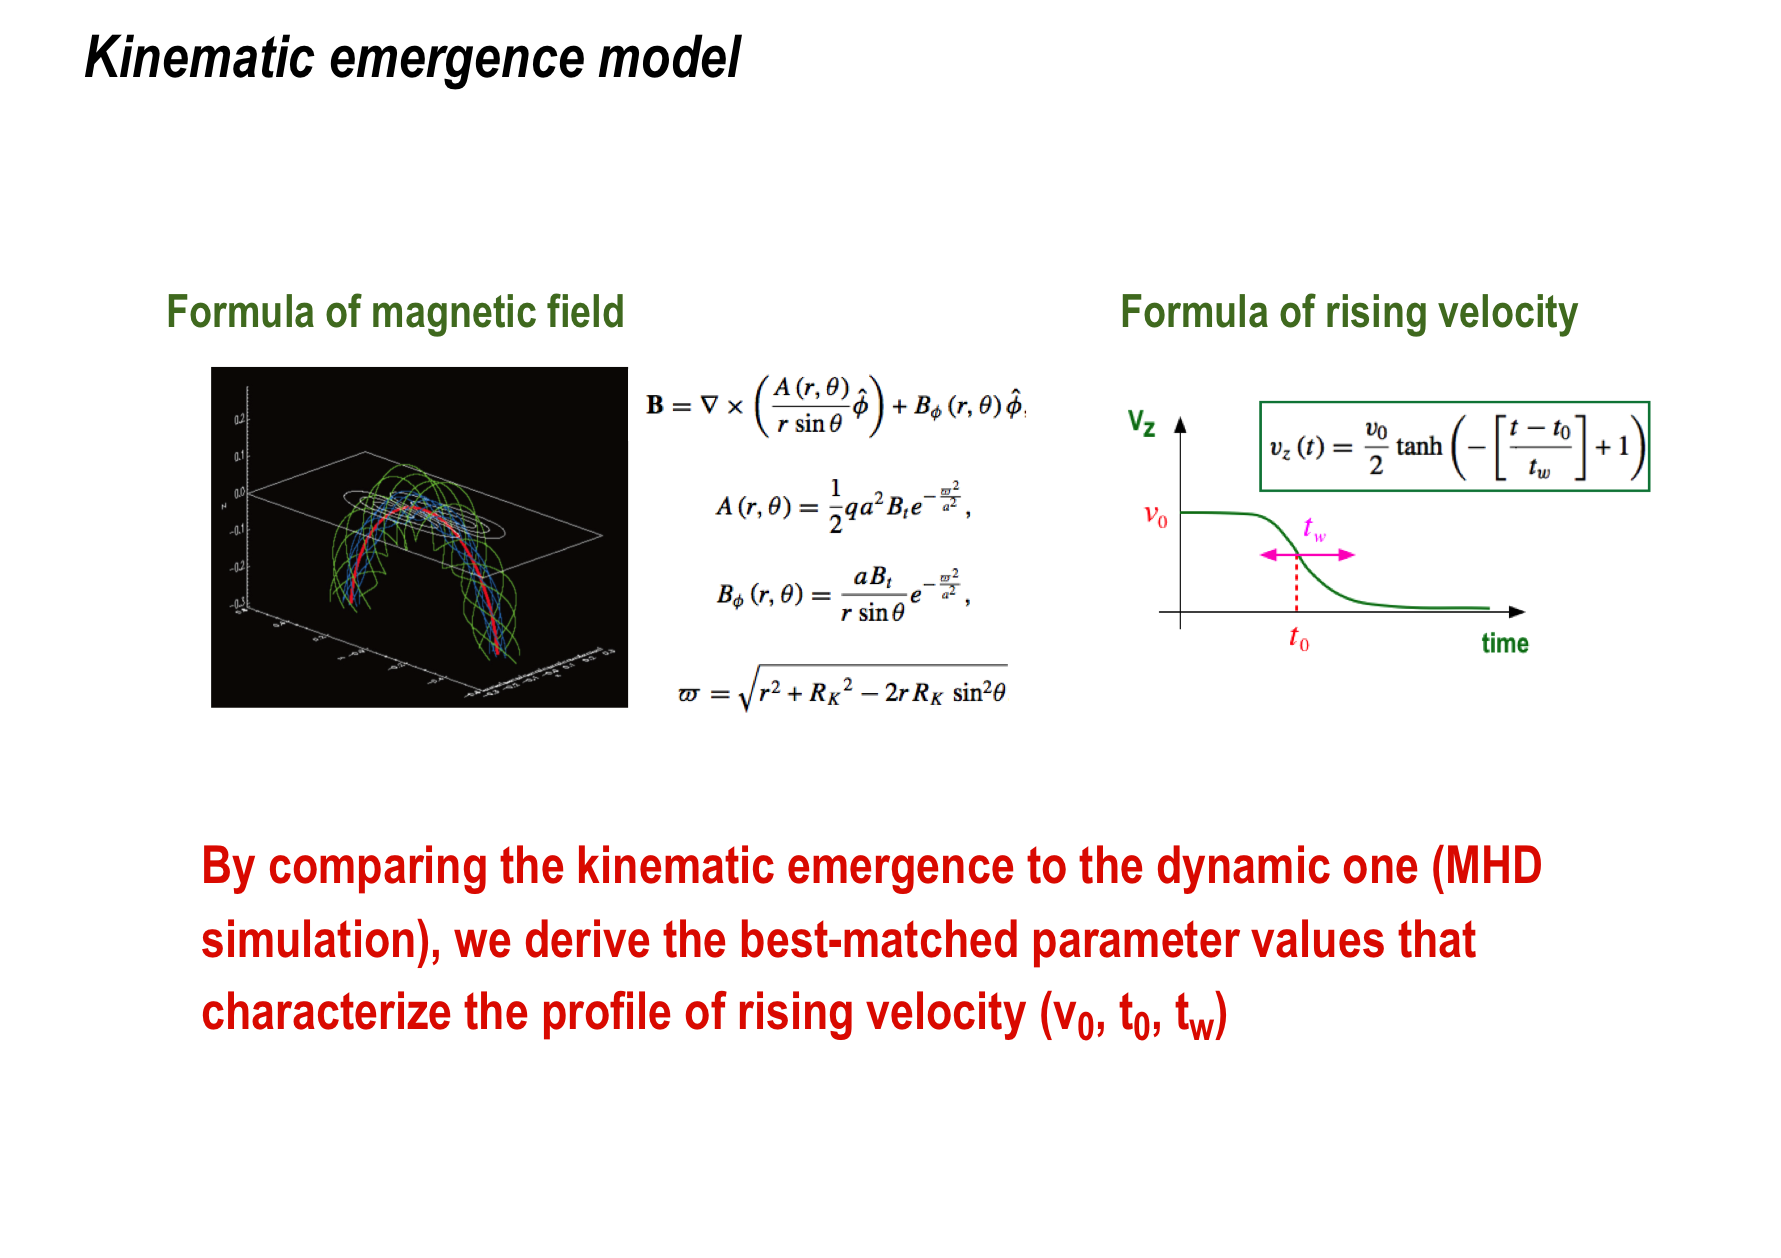
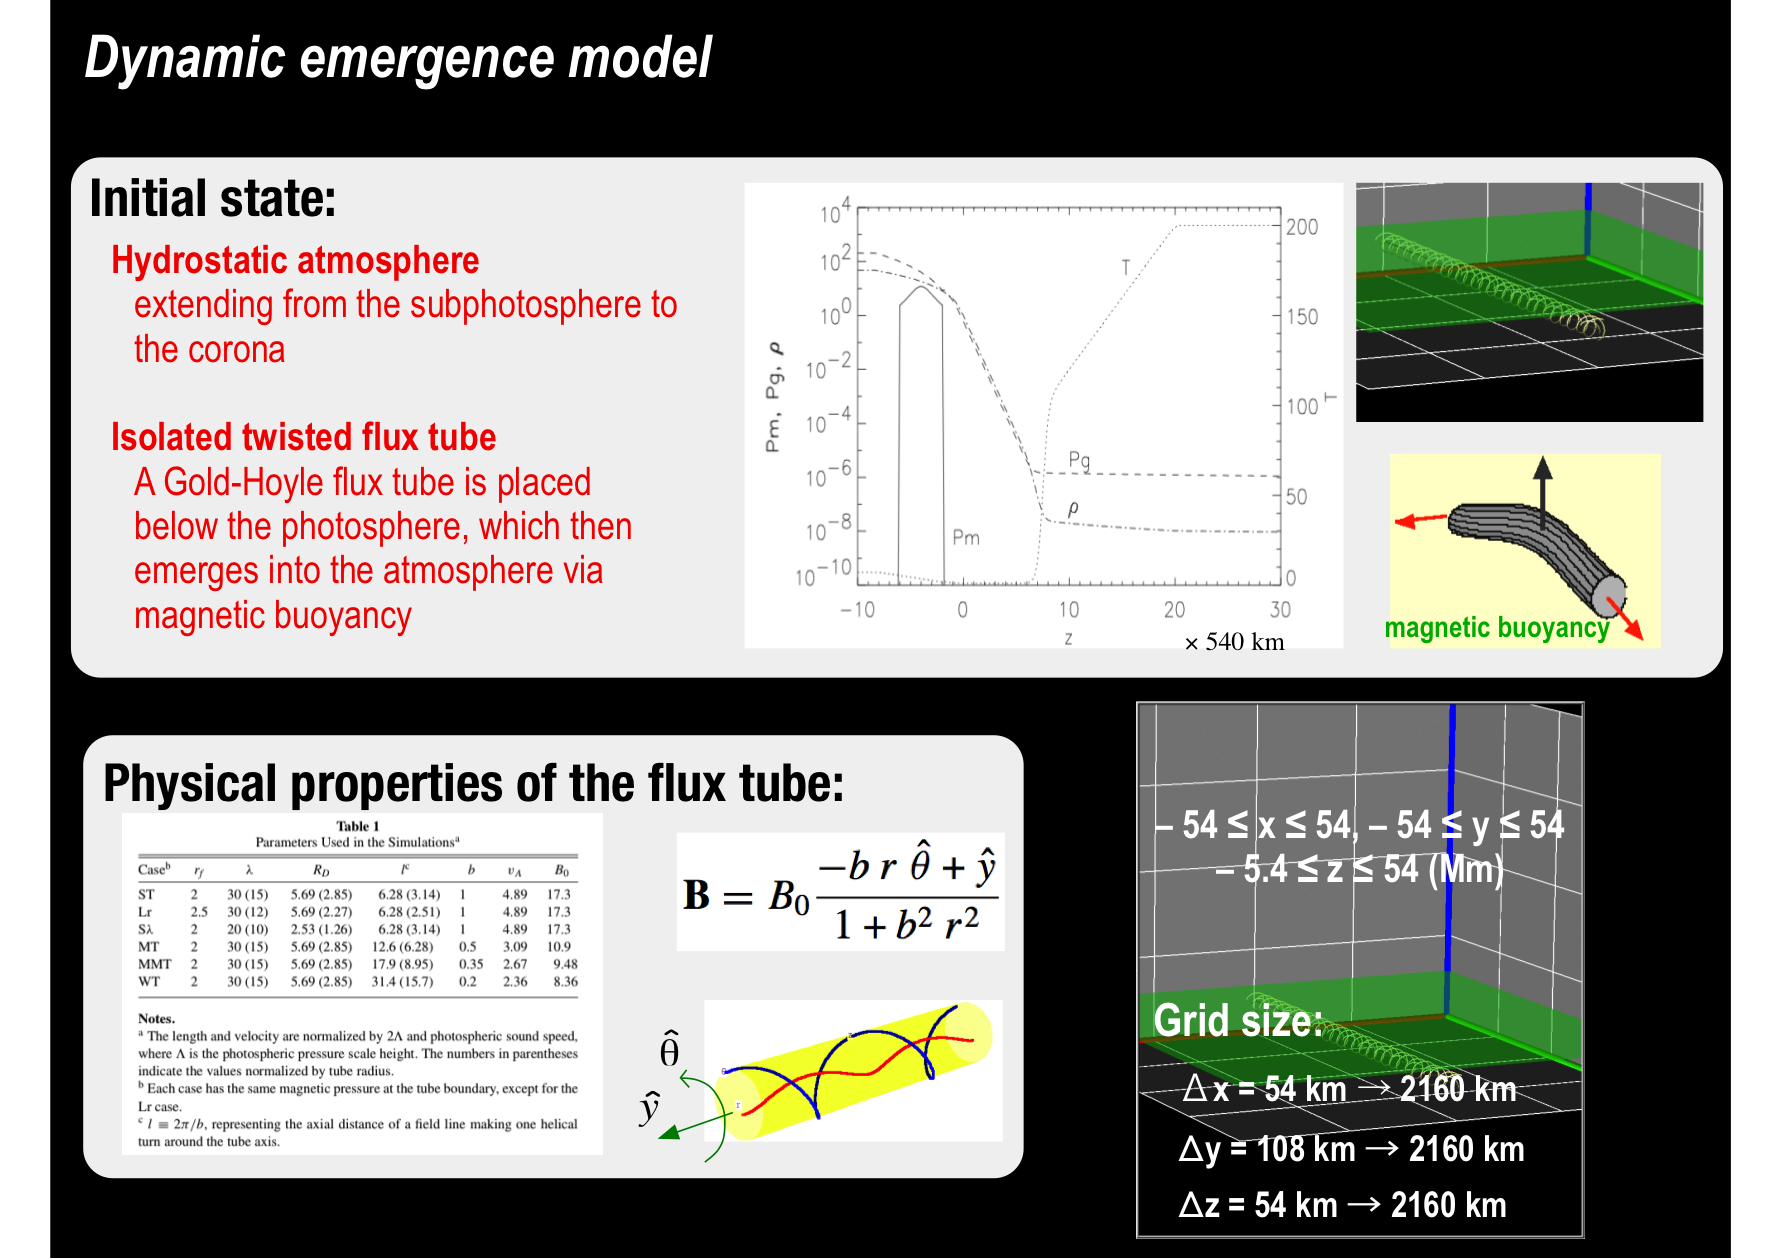
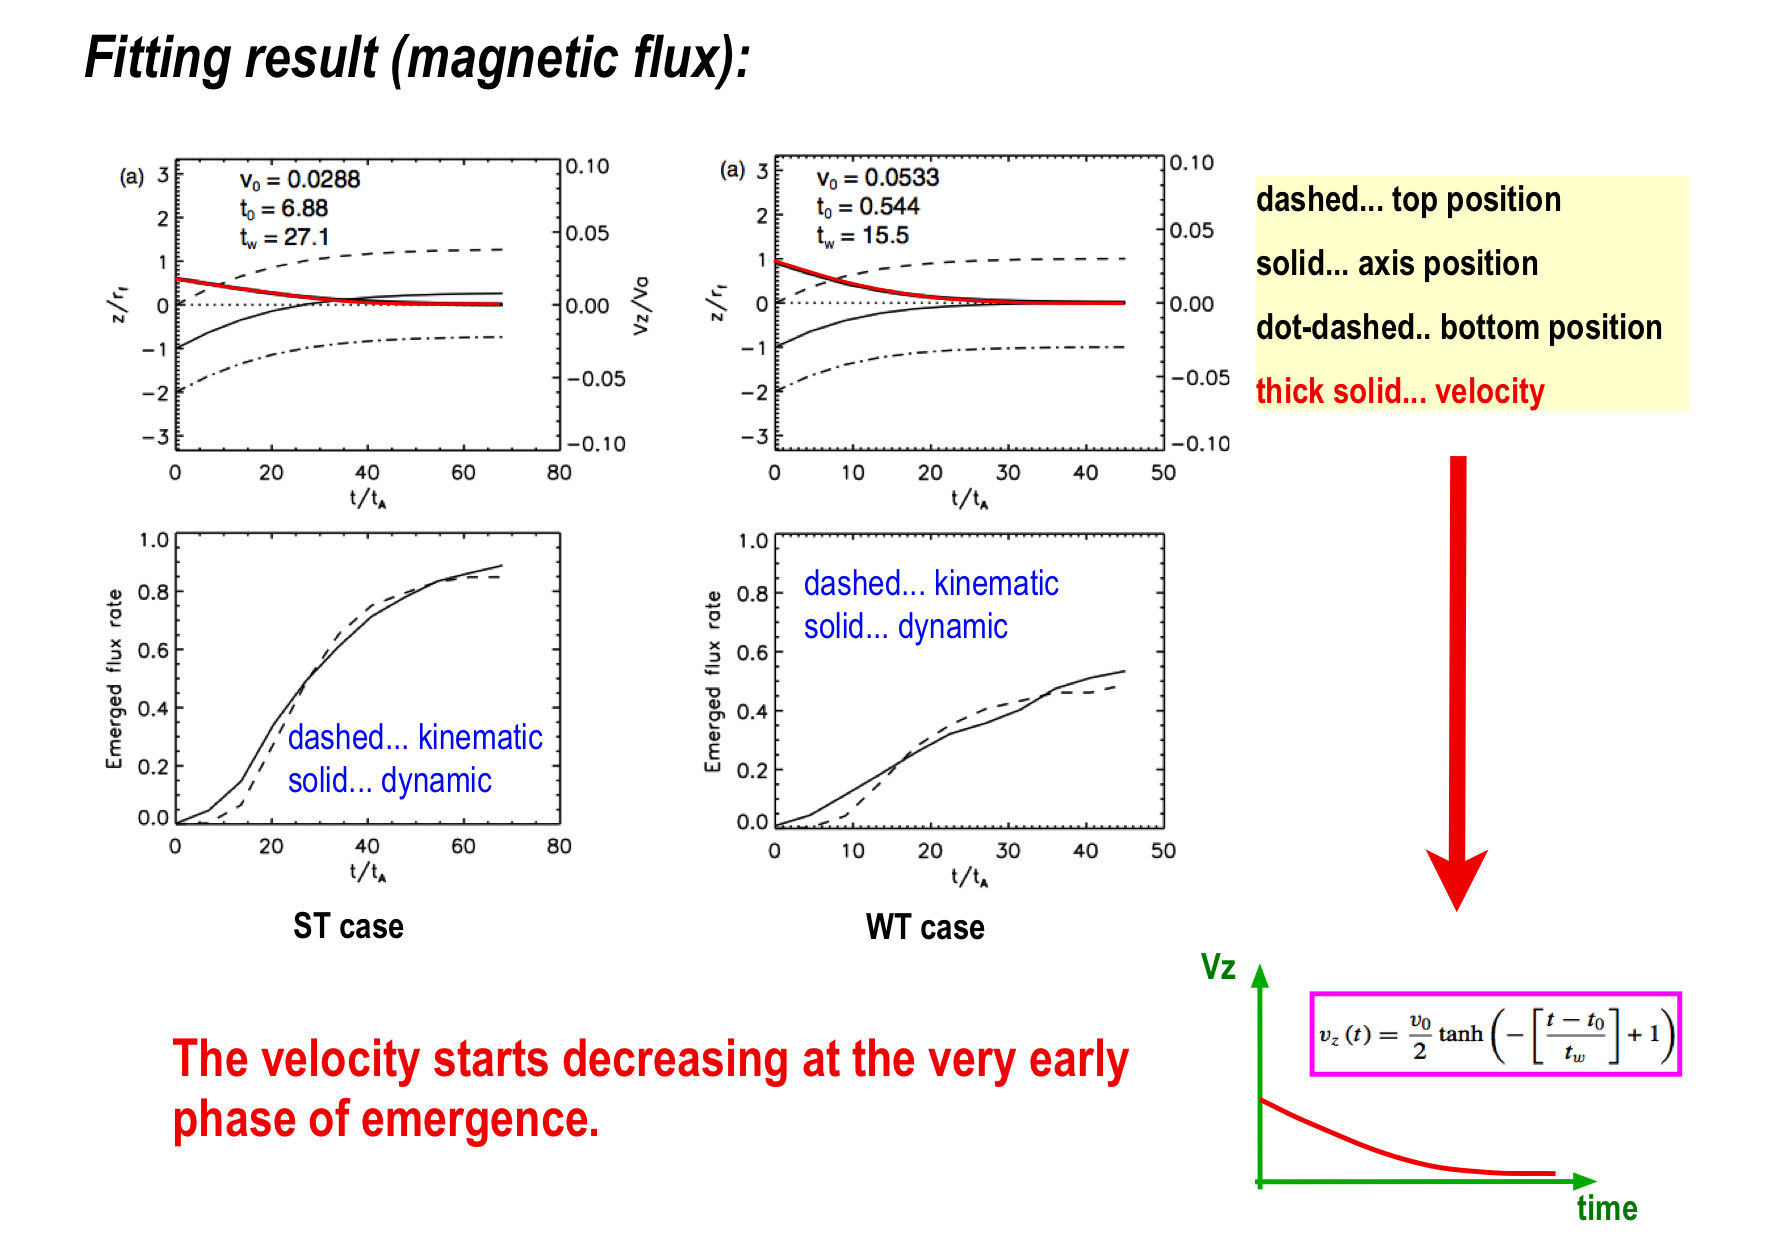
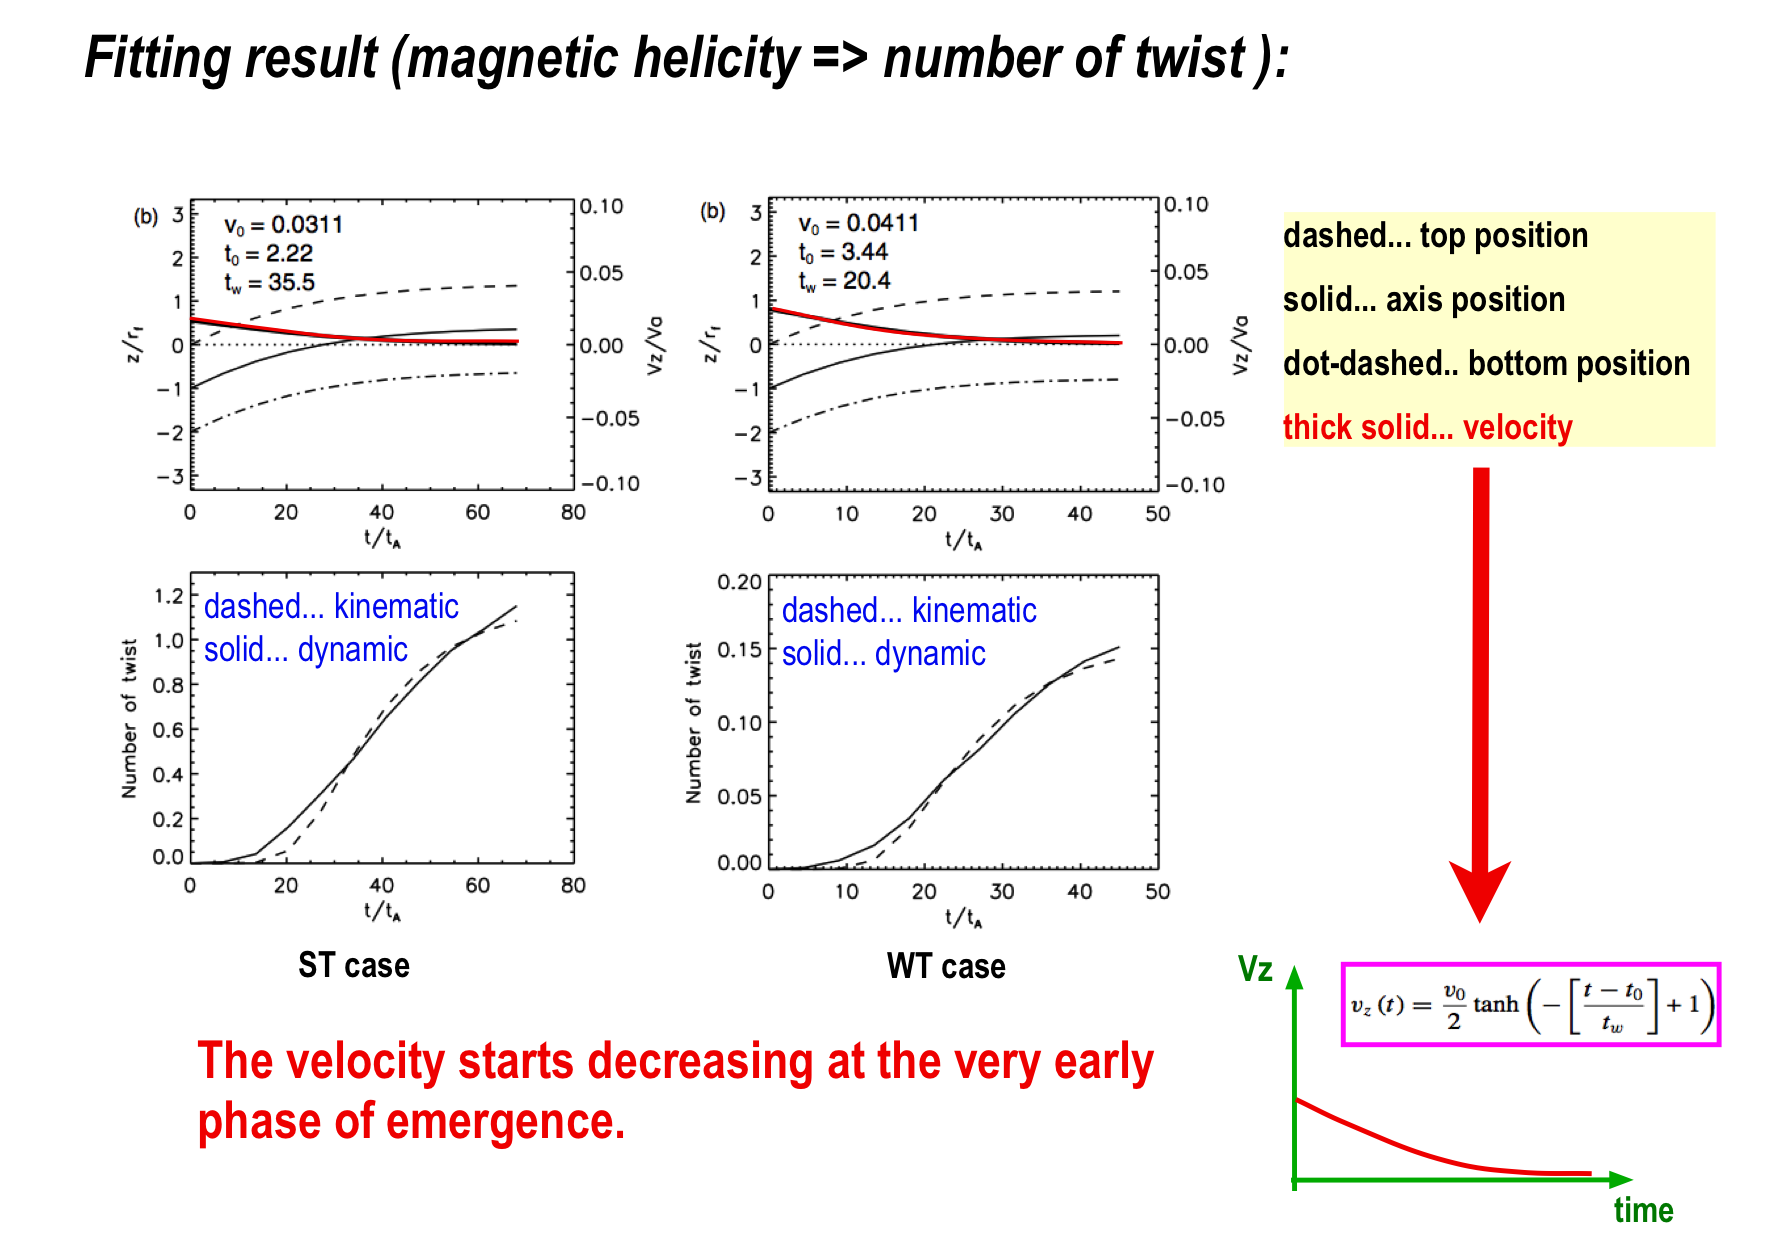
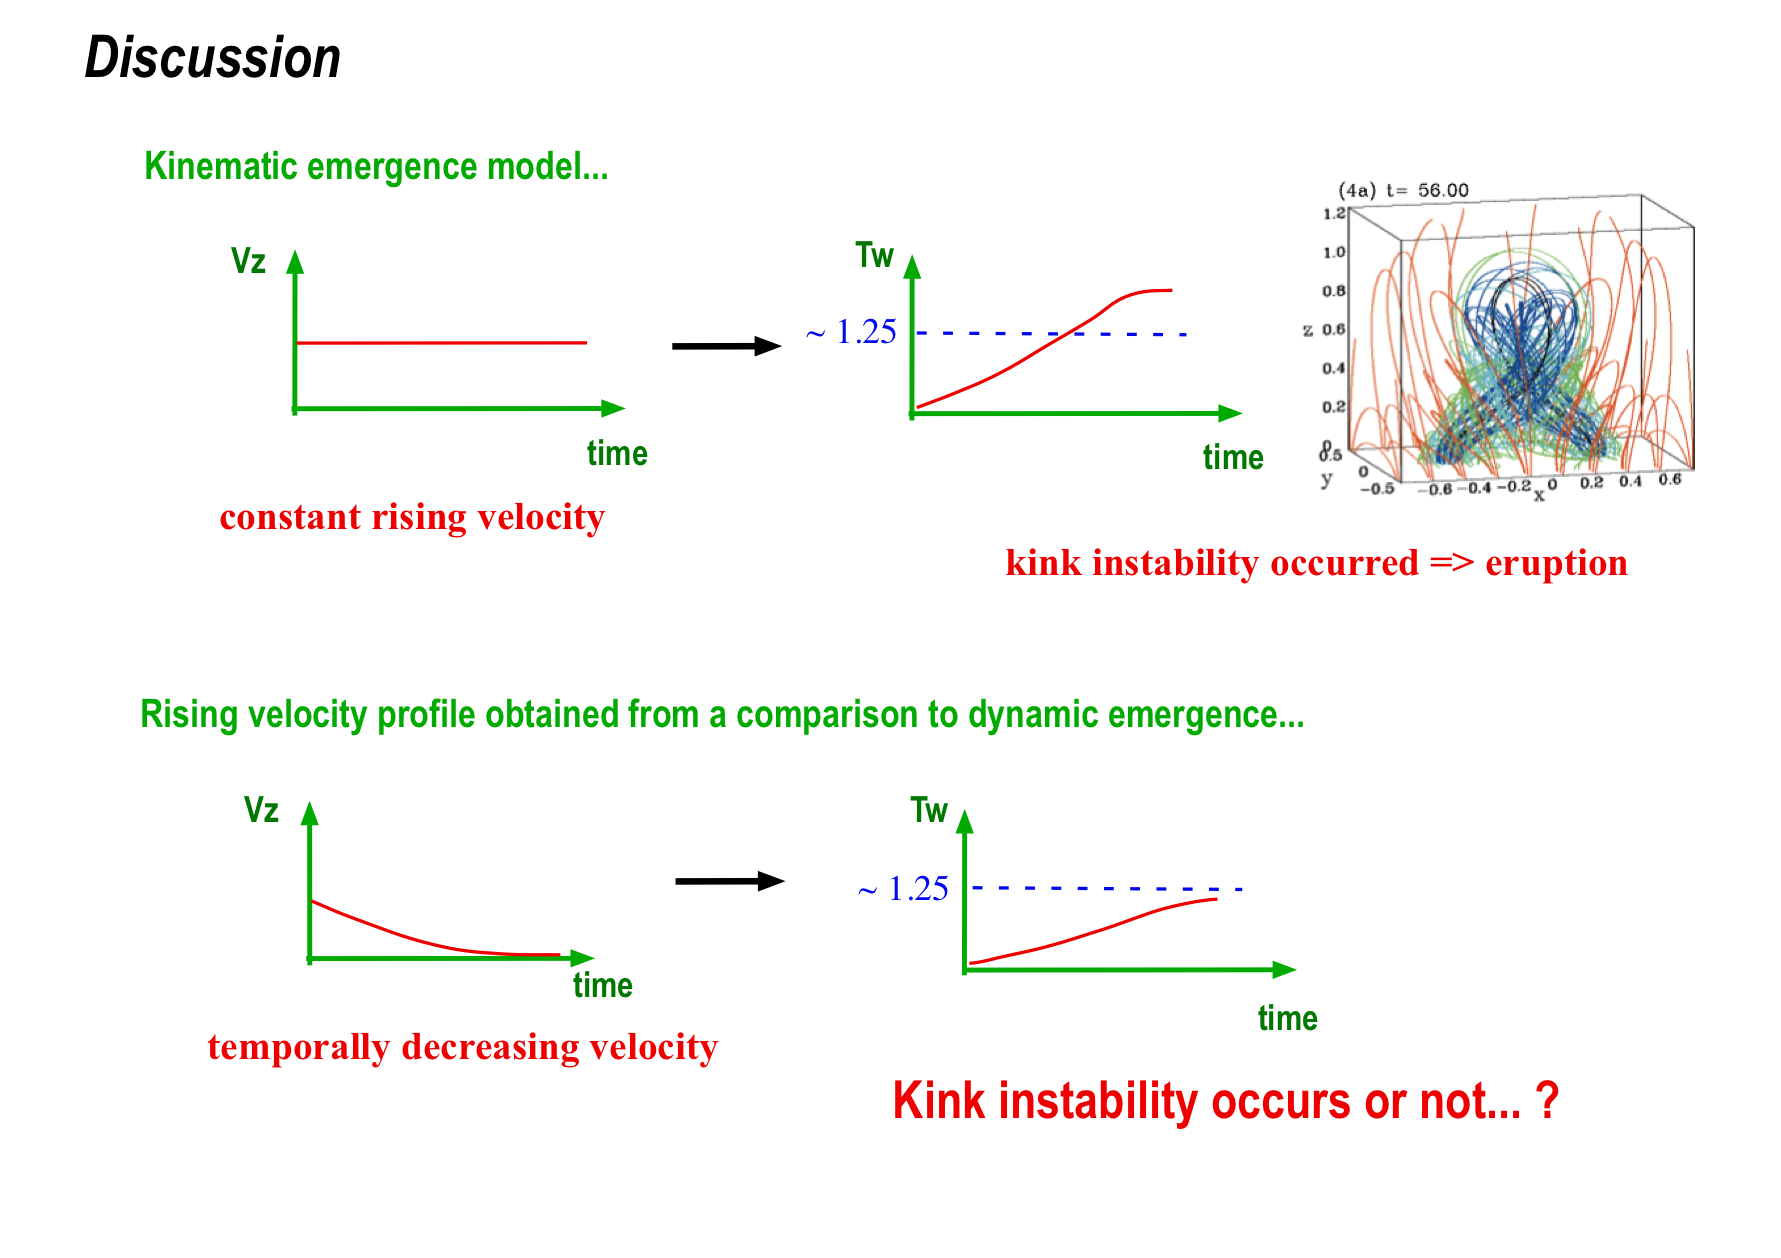
To investigate various emerging flux tubes, we used not only a dynamic emergence model with self-consistently determined rising velocity, but a kinematic emergence model in which a flux tube emerges into the surface according to a prescribed temporal profile of rising velocity (Fan & Gibson 2004).
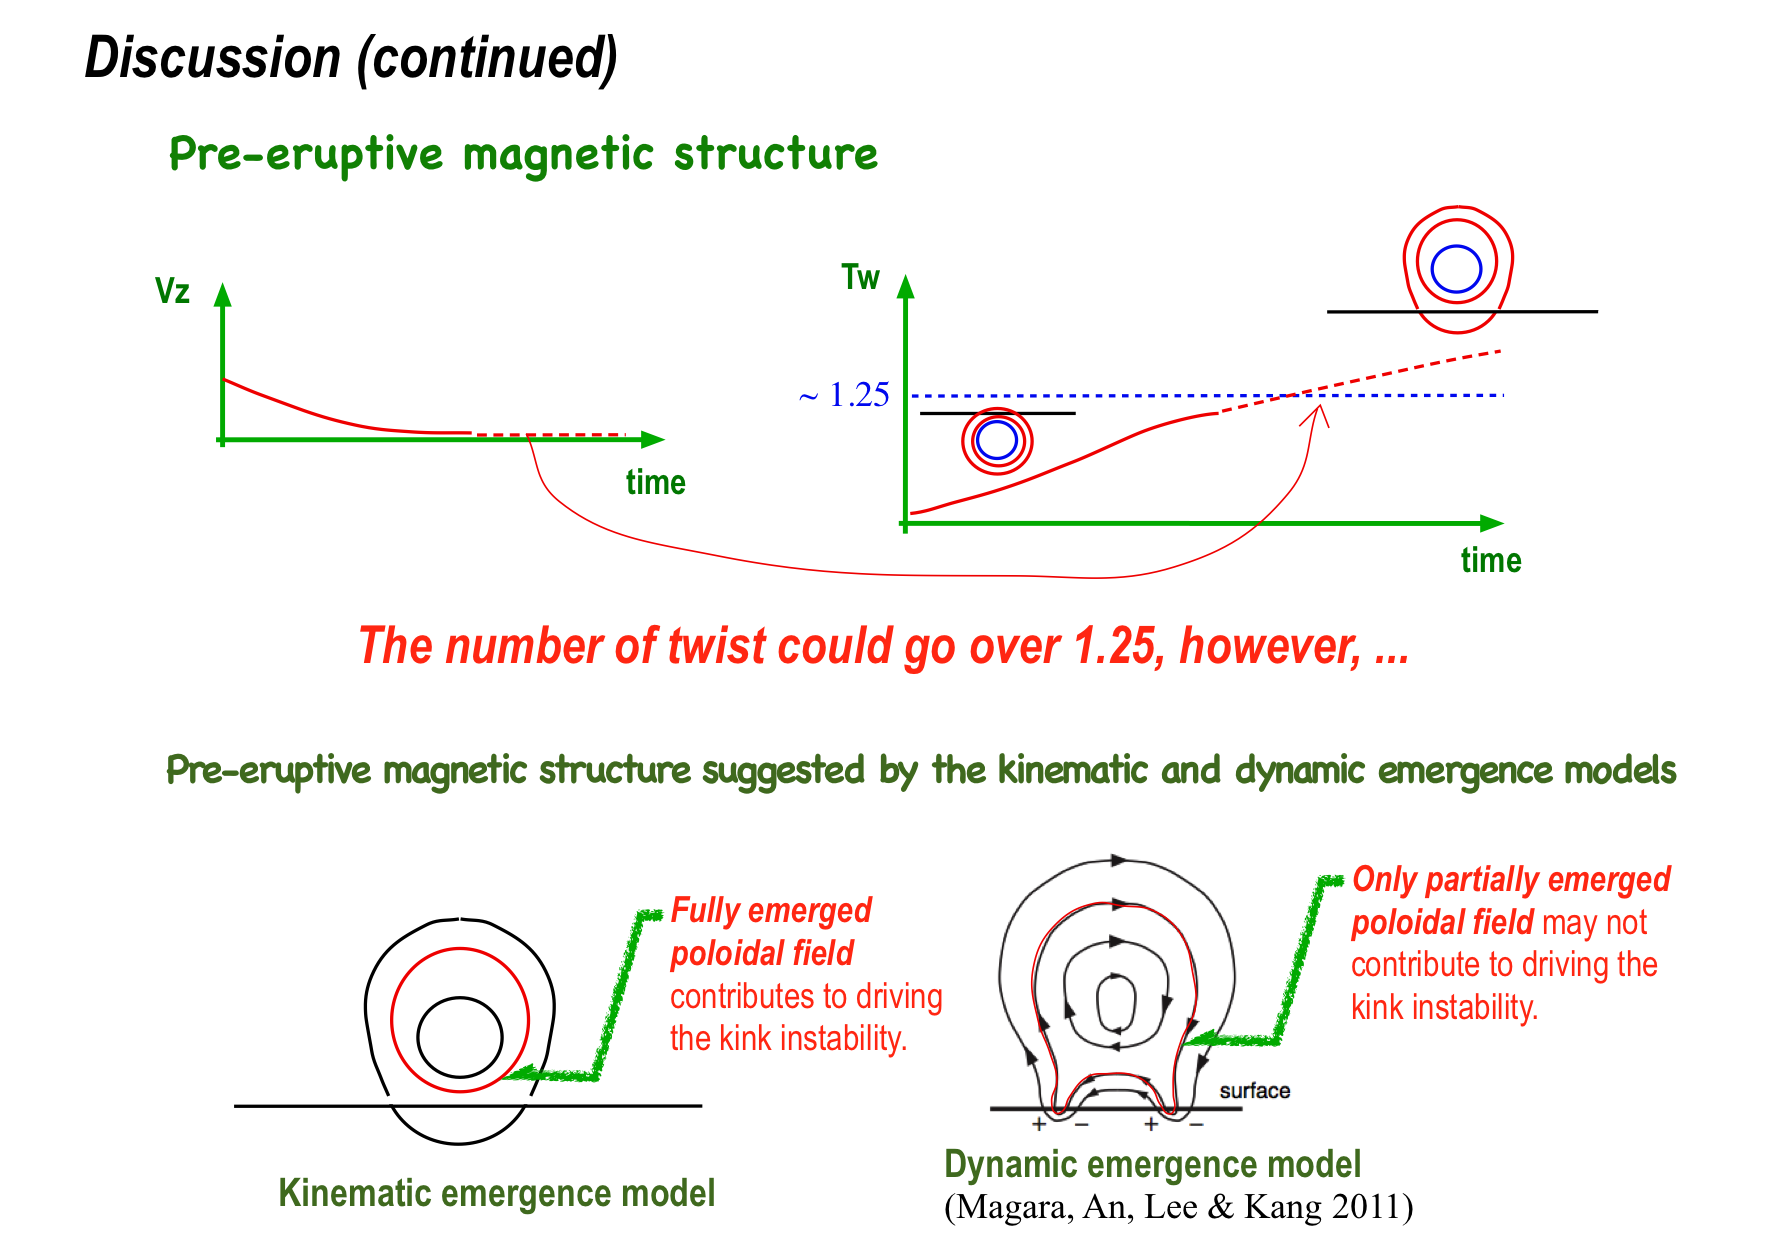
We derived appropriate profiles of the rising velocity by comparing the kinematic model to the dynamic model where different magnetic profiles were applied to the flux tube; the profile is given by radius, field strength, field-line twist, and undulation wavelength. We then discussed differences in pre-eruptive magnetic structure between the kinematic emergence model and dynamic emergence model (Magara 2012).
Reference
Magara, T. 2012 ApJ, 748, 53
Fan, Y. & Gibson, S. E. 2004, ApJ, 609, 1123
Magara, T. et al. 2011 JKAS, 44, 143